

In our last blog post, we talked about how graceful change can be an idea that applies not only to buildings, but other things built, including websites. We described the idea of shearing layers in websites as a way to determine what parts of a site should change, and with what relative frequency. These included Purpose, Information Structure, Containers, Transactions, Wayfinding, and Content.
Read moreTell Better Stories with Proportional Analysis
Proportional analysis is, simply put, a demonstration of the ratio between two or more measurable items. If someone looks at a picture or chart and easily can say, “this thing is almost as much as this other thing,” or “this is about half of the other thing,” that chart is using proportional analysis. The tool is endlessly useful; in fact it’s the secret weapon of almost all great analysts. But it really shines when when one of the metrics as familiar and the other is novel. In those situations the observer may suddenly get a new and different perspective on a new world.
Read more"Built-to-Last" IA Deliverables, Part III: Integrating Models to Create Deep Meaning
In Parts I and II of our “Built-to-Last” series, we talked about two major concepts for creating effective deliverables in Information Architecture (IA). Part I described how to create contextually appropriate and concise models. Part II demonstrated that using contextual inquiry to get deep involvement from stakeholders would improve understanding in the future.
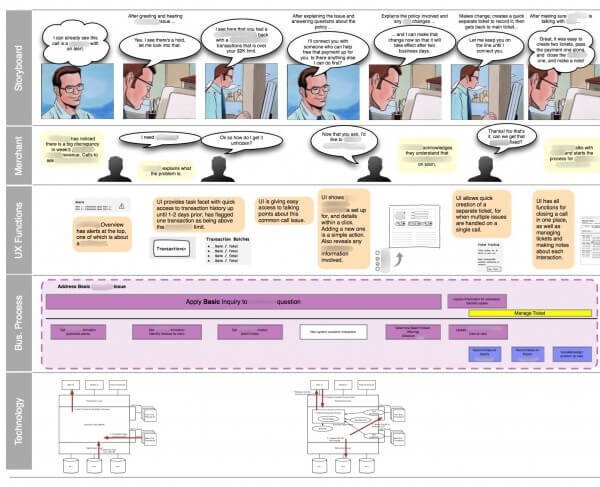
In this section we tackle the greatest challenge to effective document delivery: all organizations making anything that involves software are looking at a problem set with multiple layers of technology, stakeholders, and objectives. In short, all modern projects are complex projects, so it is incumbent on any deliverable to find a way to embrace and manage that complexity.
Read moreYou Lost Them at “Glossary”: Create a Structural Vocabulary

A structural vocabulary will help your project team make choices about design and implementation.
Read moreThe Street Sign: Navigation and Findability

Sites need guides, the friendly voice helping people discover spaces where they can learn, work, and play. Most sites try to do this by adding 3 major navigation strategies: directional signage, maps, and indexes.
Previously we gave an overview of each of these guide strategies, along with some pointers about how you can pick the right one for your site. This post gets into more detail about the classic and original web navigation guide: directional signage.
Read moreDumb Models Aren’t for Dummies: A Case Study in Information Architecture
A real-world example of Dan Klyn's structure and strategy approach to client communication, using really dumb models.
Read more"Built to Last" IA Deliverables, Part I: Model Selection
How do we use models to make IA deliverables that are "built to last"? Daniel O'Neil covers two major concepts: audience and context selection.
Read more“Built to Last” IA Deliverables, Part II: Contextual Inquiry
The best way to approach "design" is through contextual inquiry to gain a deep understanding of the immediate, physical context in which work will be done.
Read moreSupercharge your E-commerce Product Catalog
Optimize your e-commerce websites by using a product-driven taxonomy to organize it, by the unique qualities of the products themselves.
Read moreSupercharge your UX with Information Design
User experience is made better by good information design. We describe 3 kinds of information processing and describe the best way to design for them.
Read moreThe Headache and Promise of High Information Interfaces
While UX and design practices are better than ever, the challenge for 2017 will be avoiding these 4 "anti-patterns" emerging in high-information interfaces.
Read moreThe Index as Web Guide: Knowledge-based lookup
The index is the original search tool of the literate world. When does it make sense to use them on your site to look things up?
Read moreThe Map as Guide: Context and memory
Maps are important when your users need to see the context of possibilities related to an idea, especially if your user can’t recall the original idea.
Read moreIs search the best findability strategy for your website?
What is the best onsite findability strategy for your website? It depends on your users, what they already know, and how complex your site is.
Read morePlan Before You Build: Architecting Digital Places
TUG's PASS process helps us translate your business strategy into an information strategy, so you can architect digital places that deliver great UX.
Read moreWhen is the Right Time to Plan Your Website?
When is the right time to plan your website rebuild? The right time to plan your website rebuild is AFTER your company has a vision in place, but before you start to build it.
Read moreHow Does TUG Guide Web Development?
TUG helps you discover the true intent of a project, and keeps your vision coherent throughout your web development efforts.
Read moreCognitive Principles Driving Design
Daniel O’Neil reflects on the different kinds of cognitive approaches people use when confronted with certain kinds of information.
Read moreBig Data And Real User Stories
From Google Analytics to our merchant and fulfillment systems, insightful customer-centered marketing strategy is just a spreadsheet away! What is key about this explosion of data is that it requires an even greater commitment to story-driven strategic marketing. If data is not judiciously applied to the human narrative, marketing departments can be pushed into reactive, tactical activities against tiny bits of information. We think you should go big instead, and use the data for high-level marketing strategy and planning.
Read moreFind Your Information Sweet Spot
What makes a site "sweet"? Some would argue that this is a problem with complexity, and that "making the complex clear" is the way to solve it. But ultimately, both "complexity" and "clarity" are aspirational outcomes, not techniques. We can work towards the objective of making the complex clear, where complex means "the crazy world we live in" and clear means "understandable in context without extra ornamentation." So what techniques can we use to get there? Well, a key one is to characterize how users grapple with and understand information as a core element of the design. In other words, decide what you can expect cognitively of users when they use your interface.
Read more