
The idea of a road map is pretty fuzzy. People typically see them as a project plan or a project charter, but we see them a little differently. For us, road maps are a tool that defines “what we are building, in what order, and what we need to build it”.
Read moreThree Guidelines For Making Useful Taxonomies
A truly good taxonomy DOES THINGS and is needed to DO THINGS. In other words, most taxonomies should be created for practical, specific use, like finding a book, describing a series of technical standards, or organizing an e-commerce clothing store.
We're going to share the three major steps for making useful taxonomies that help us map out the world. They are:
Be Necessary and Sufficient
Have a Purpose
Plan for Change.
Reimagining Collaboration: A Playful Approach to Facilitating our In/Tension Workshop
In our recent experiment with our In/Tension Modeling workshop, TUG introduced an innovative approach by incorporating toy wooden blocks, transforming the traditional alignment sessions into more engaging and interactive experiences. This method significantly increased participation and enriched discussions, allowing stakeholders to visualize strategic tensions and outcomes more effectively. The experiment underscores the importance of integrating fun and playful elements into workshops to foster creativity, collaboration, and a deeper understanding among participants, offering valuable insights to enhance any workshop session.
Read moreApplying a Service Design Lens to Information Architecture Practice

Travis delves into the integration of Service Design principles into Information Architecture practices, emphasizing the importance of understanding organizational needs and overcoming departmental barriers. Service Blueprints emerge as a pivotal tool, expanding on customer journey flows to include organizational actions, both visible and behind-the-scenes. However, the article also raises concerns about the potential misuse of such blueprints as mere buzzwords without grasping their true essence. Drawing inspiration from Lou Downe's "Good Services," the piece underscores the significance of clear intent, user-centric design principles, and the need for sustainable governance. The overarching message is the continuous evolution and adaptability of service design, emphasizing collaboration, feedback, and preparedness for inevitable service failures.
Read moreBeyond Jargon: The Power of Plain Language in Information Architecture

This article, written by Emily Claflin, emphasizes the importance of plain language in information architecture. Plain language, promoted by the US government's Plain Writing Act in 2010, simplifies communication, making information easily understandable. It's particularly valuable in information architecture, where it aids in understanding complex information. The article outlines the US Government's eight guidelines for plain language, including audience-focused writing, organization, word choice, conciseness, conversational tone, design, web standards, and assumption testing. Ritter provides tips for incorporating plain language into writing and concludes that its use benefits everyone by saving time, reducing errors, and improving communication.
Read moreDan Klyn's Three Core Tenets of Information Architecture

AI Generated art using Midjourney with the prompt, “an abstract work that encapsulates the profound, multi-dimensional domain of Information Architecture and symbolizes: Structure and Organization, User Experience (UX), and Semantic Environment. “
Dan has a “big picture” view of Information Architecture. Information Architecture – all architecture, really – is about making the places we create good. A “Good” structure can manage the forces acting on it, be it rain, sun, heat, or cold. Achieving “good fit” between a structural form and the many forces in the environment is the role of architects and architecture.
This is true whether you are building a house or a web application! The forces a website faces are vastly different than those of a house, but they have just as much of an impact as rain does on a roof, and getting good fits is just as important.
This course will teach you how to realize that fit in your information projects.
Read moreHelp Your Product Managers Succeed With Blueprints

Daniel O’Neil at The Understanding Group talks about the magic of good product managers. Good PMs are most effective when they think like architects. Architecture is best when it uses blueprints and blueprints are different from requirements. Not all product managers know how to make blueprints, but they love to use them and they achieve great success for their team when they have them. Find out ways you can set your PMs up for success!
Read moreManaging Conceptual Debt: Using Modeling to Gain Understanding

Summary: Conceptual debt, which is the sum of unearthed assumptions, needs, and tensions, are within every business and project. It causes more problems for software than poorly written code. Conceptual debt can be addressed with better models of your processes, data, products, and services.
The first thing to do to tackle conceptual debt is to create a modeling culture, especially among your strategic thinkers and planners. The approach is profoundly powerful, but requires courage to embrace. Courage is vital! because when we go deeper in the understanding of things, we discover competing needs, politics, and hidden assumptions. As Einar Hørst puts it, “technical work is puzzle solving, whereas modeling work reveals tensions.”
Read moreModel Play Session #2 - The Relationship of Books within Your Home
Modeling is a practice that leads to understanding. In this second challenge, our TUG associates were invited to create a model centered around their libraries or relationships with/to books.
Read moreModel Play Session #1 - Light Sources in Your Home
Creating models is a practice that leads to understanding. So, each week we do just that, practice modeling. The week starts off with a fairly open-ended “model prompt” that all TUG associates are invited to use to create a model. Then, on Fridays we get together for an hour to both critique and explain our models to one another in the hopes of mutual growth in this vital skill. It’s fun and we’re having a good time with it. There are so many options when modeling and we thought it’d be fun to show how different and creative they can be. This week’s challenge is to communicate information about the sources of light within one’s home.
Read more3 Ways to Tell If Your Organization Suffers from Conceptual Debt

Summary: Technical Debt (“the code is broken, here’s a fix”) is mostly understood and acknowledged while Conceptual Debt (“why’d it happen? what areas are impacted? Are we in alignment on what good is?”) goes largely unacknowledged. That is, until the discord around your software/app/website/etc seems insurmountable. The good news is that there’s no reason you can’t start addressing conceptual debt problems today.
Technical Debt (“the code is broken, here’s a fix”) is mostly understood and acknowledged while Conceptual Debt (“why’d it happen? what areas are impacted? Are we in alignment on what good is?”) goes largely unacknowledged. That is, until the discord around your software/app/website/etc seems insurmountable.
Conceptual debt occurs when an organization makes bad design choices from adopted models that don’t align with the business and customer needs. This kind of debt is not easily recognized and is prevalent in most teams lacking a solid digital strategy. While technical debt gets all the press, conceptual debt is the undetected metaphorical hammer that is coming for digital places (software, app, intranet, etc).
Read moreIn/Tension Modeling Gains Alignment Needed

Misalignment from stakeholders creates not only differing ideas about structure but also the languages within them. Without proper alignment from the beginning of a project, it’s destined to fail. Understanding must precede action. Clarity at the beginning of a project is attained through stakeholder alignment, strategy, and roadmapping. In/Tension Modeling is one tool that we’ve created and use so that we can discover both the business intent and tensions that exist regarding the website, product, intranet, app, etc.
Read morePlain Language Model & Guide

In a world that’s overflowing with information, we need to make sure the content we’re creating brings real value to the people who use it. When information is hard to find, vague, dense, or filled with complex terminology, we can’t understand it. This leaves people feeling frustrated and may lead to misunderstanding. Paying attention to the barriers we build into information and removing as many of them as possible makes our information accessible to more people and enhances its value. Luckily, there’s already a roadmap for this using plain language guidelines. When plain language is combined with sound information architecture, these two approaches give you the power to bring clarity, understanding, and alignment to your information.
Read moreIs Your Company's Complexity Essential or Artificial?
Latham Sholes's 1878 QWERTY keyboard layout
Essential complexity reflects the value proposition of the organization. Artificial complexity reflects compromises or design decisions that were made to address local, short-term problems with unplanned long-term cost. Fixing the second while honoring the first is a core part of Information Architecture.
Read moreSermon for WIAD Bristol 2021
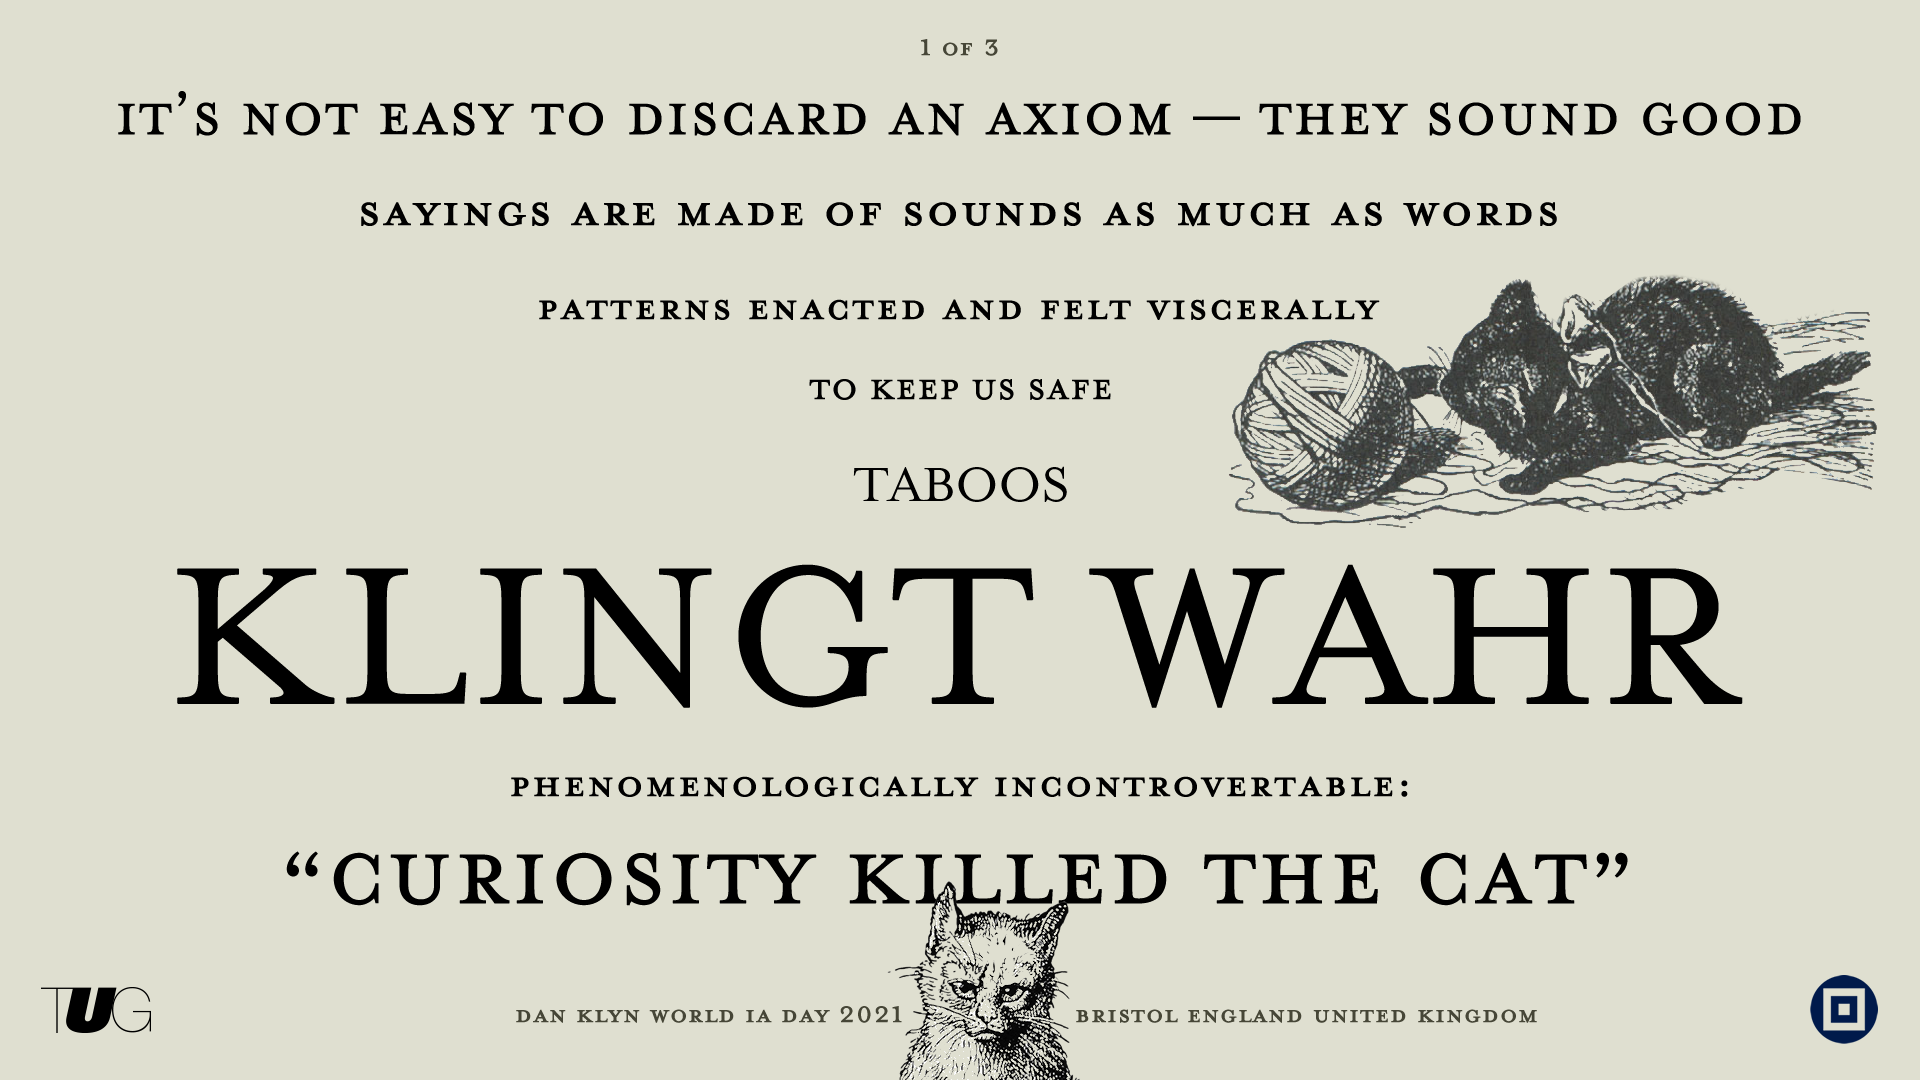
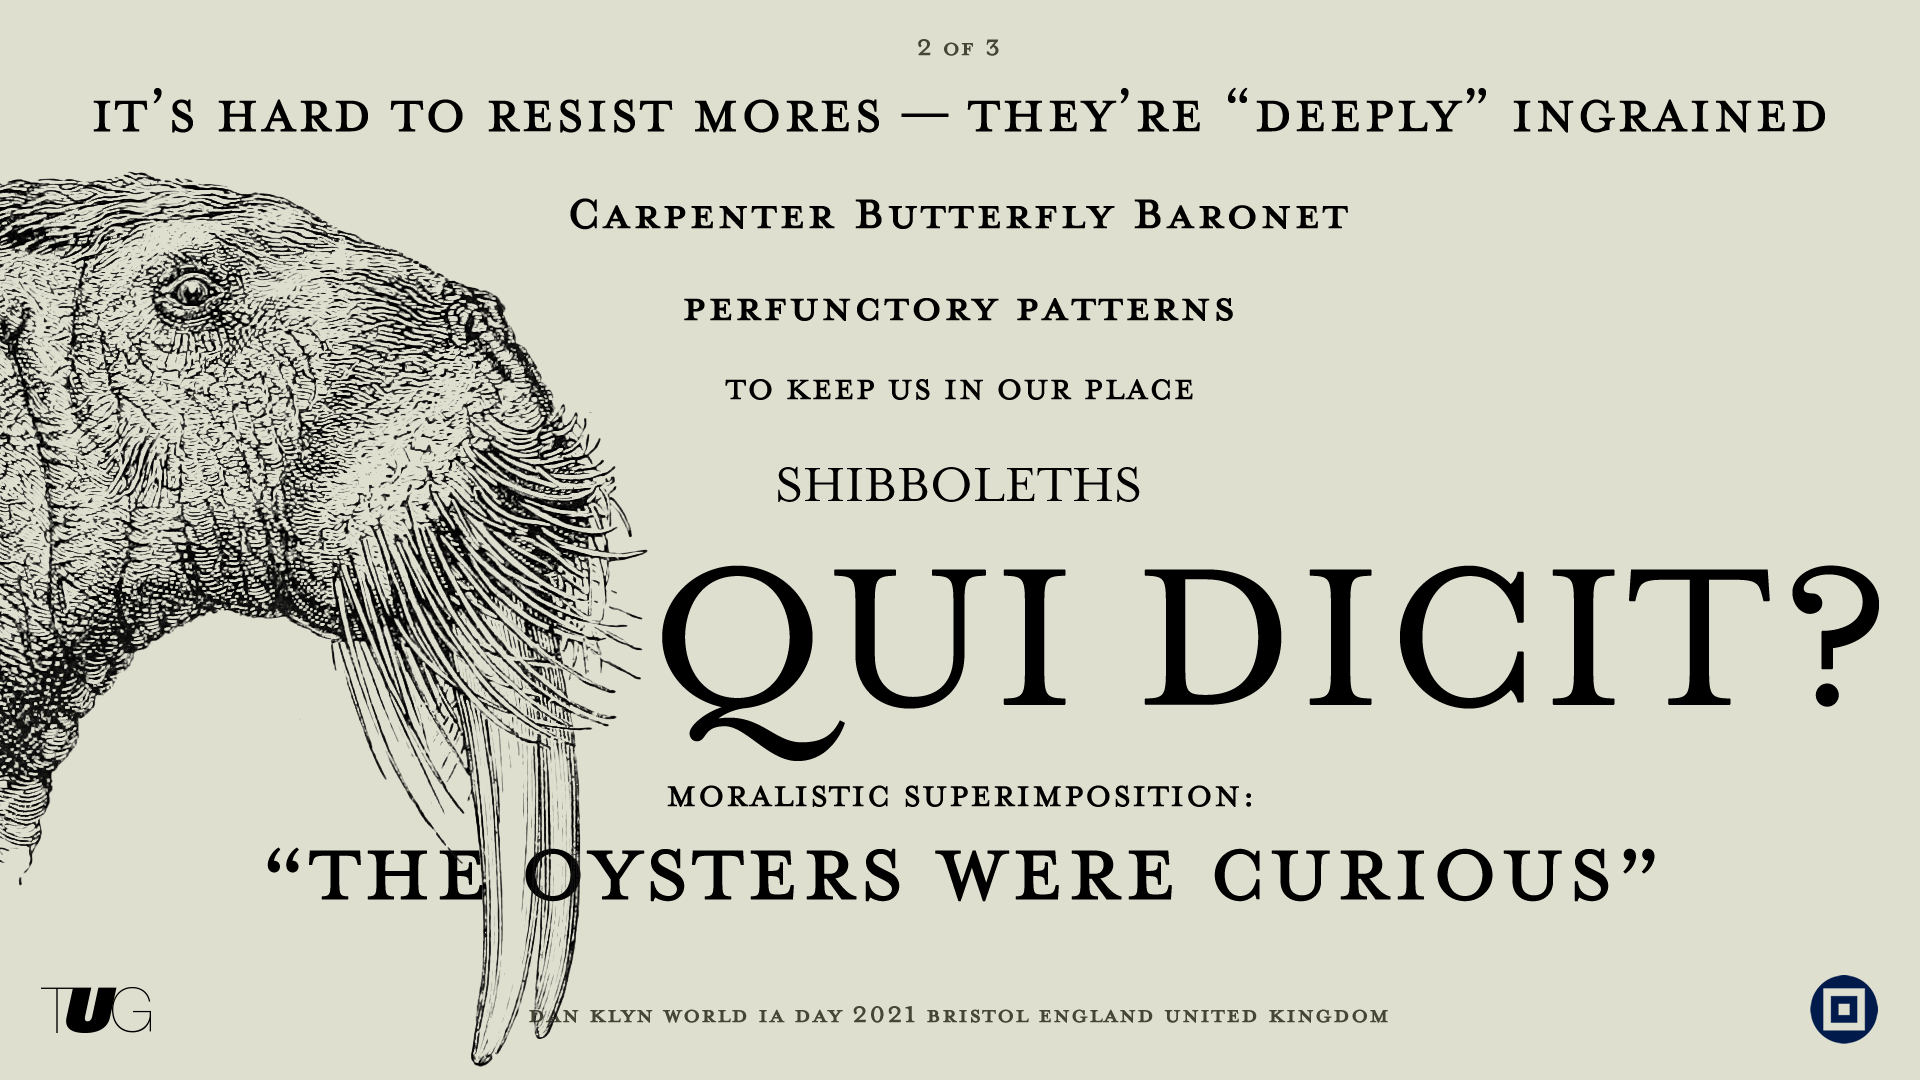
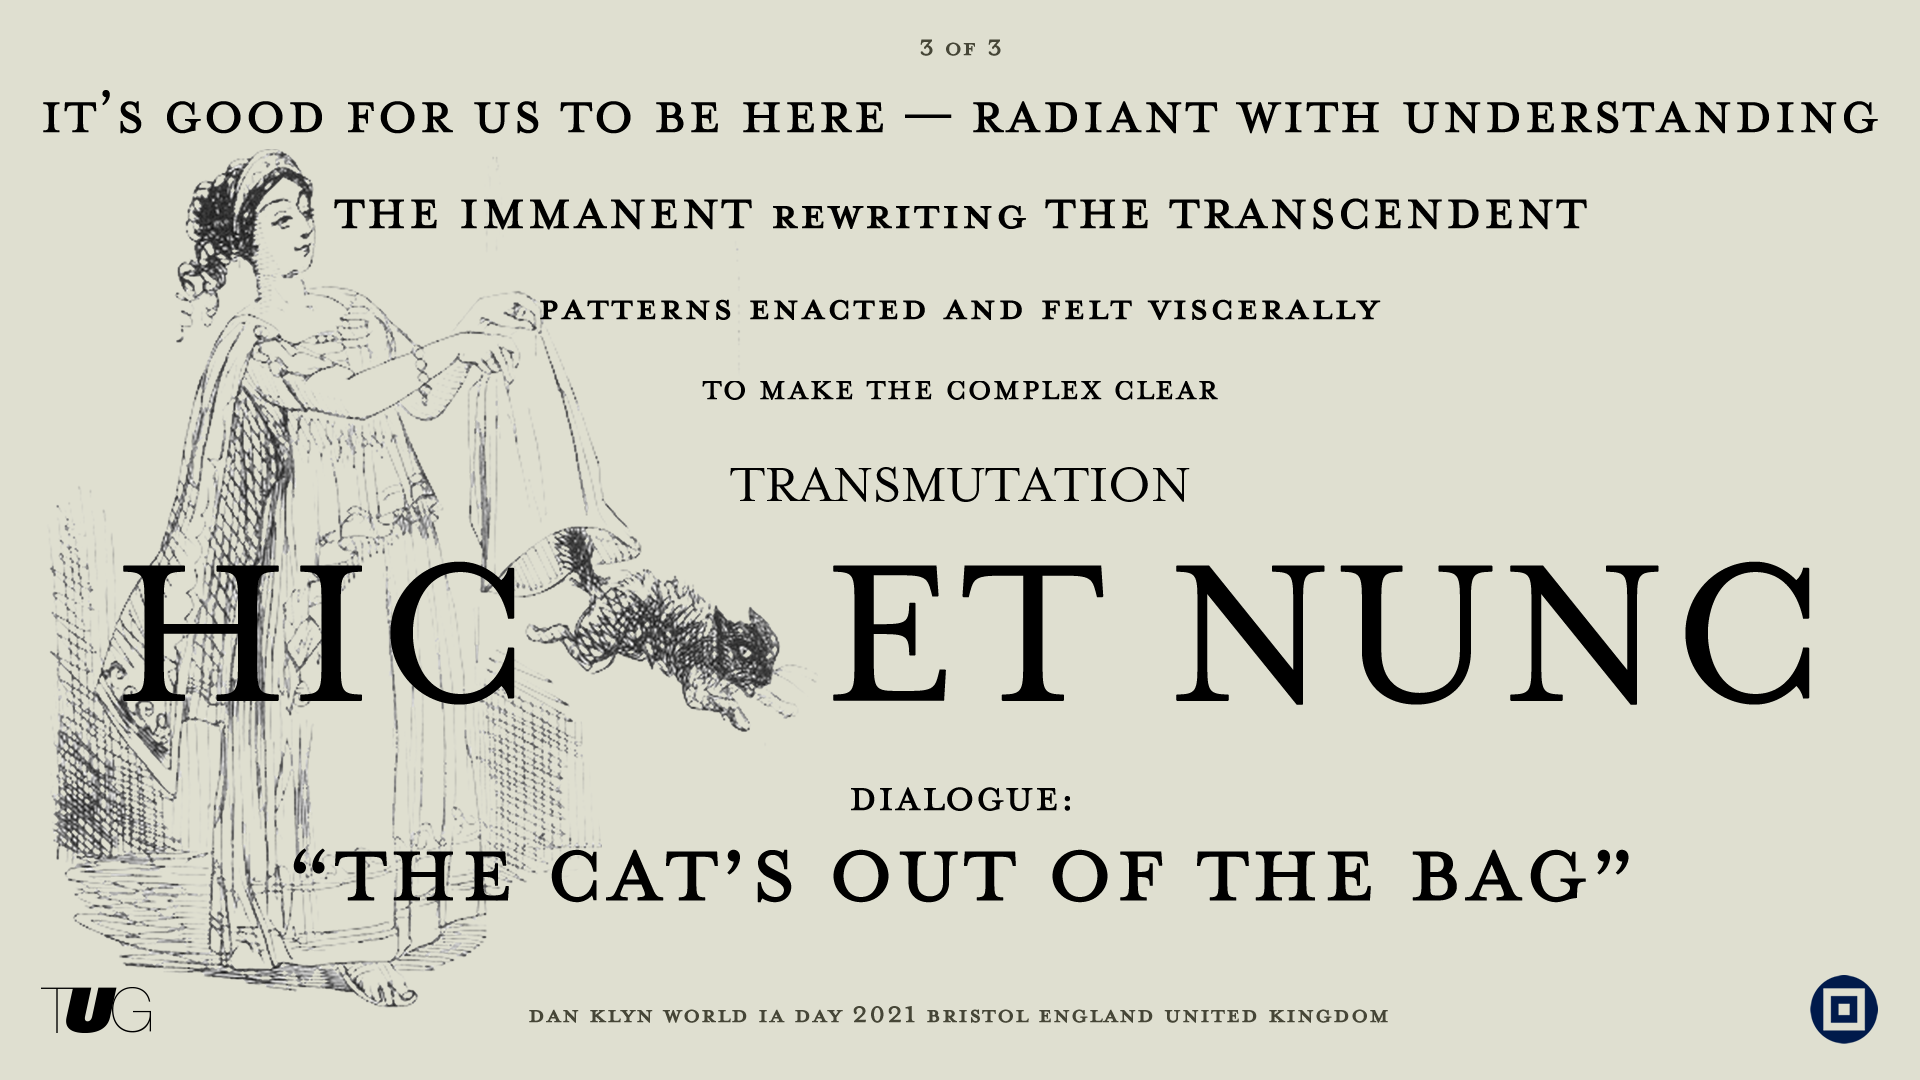
For World IA Day 2021, TUG co-founder Dan Klyn was invited to give the closing keynote for Nomensa’s celebration in Bristol. Klyn’s counterproposal was to preach a brief sermon, to be followed immediately by Q&A with Nomensa co-founder and TUG’s beloved friend Simon Norris.
Read moreTalking about TUG's Information Architecture Staycation Workshop

Dan Klyn has been thinking about how language, structure, and meaning might make digital spaces “good” for over twenty years. What distinguishes Dan from a lot of other thinkers is that he’s comfortable with the fact that figuring out the answer to that question isn’t always simple, and the answer isn’t always a straight line. This has made him one of the most creative and interesting people working in Information Architecture today.
Dan thinks these ideas are best understood through discussion and collaboration, so he created the IA Staycation, a workshop that includes both lectures and direct conversation with both Dan and Richard Saul Wurman. The workshop is unusual, in that it isn’t a simple “skill builder”, but instead brings us around to this deeper question Dan always asks: What is good? How would we know? How do we make that concept something we can use?
Read moreTalking about TUG's Modeling for Clarity Workshop

The Clear Modeling Framework cards are sent to each participant and used throughout the workshop.
Joe Elmendorf is the creator of The Understanding Group’s Modeling For Clarity Workshop, which teaches professionals how to use models to understand and explain complex problems. This article asks Joe about his thoughts on the all-remote workshop.
Read moreGraceful Change for Intranet Communities

In our last blog post, we talked about how graceful change can be an idea that applies not only to buildings, but other things built, including websites. We described the idea of shearing layers in websites as a way to determine what parts of a site should change, and with what relative frequency. These included Purpose, Information Structure, Containers, Transactions, Wayfinding, and Content.
Read moreMeeting User Expectations for the New Internet

Basically to "architect" a space means to structure your websites, intranets, portals, and applications so your visitors can connect with you and find what they are looking for.
Read moreTell Better Stories with Proportional Analysis
Proportional analysis is, simply put, a demonstration of the ratio between two or more measurable items. If someone looks at a picture or chart and easily can say, “this thing is almost as much as this other thing,” or “this is about half of the other thing,” that chart is using proportional analysis. The tool is endlessly useful; in fact it’s the secret weapon of almost all great analysts. But it really shines when when one of the metrics as familiar and the other is novel. In those situations the observer may suddenly get a new and different perspective on a new world.
Read more